> For the complete documentation index, see [llms.txt](https://docs.perfectscale.io/llms.txt). Markdown versions of documentation pages are available by appending `.md` to page URLs; this page is available as [Markdown](https://docs.perfectscale.io/visibility-and-optimization/bin-packing-optimization.md).
# Bin packing optimization
Learn how to optimize Kubernetes bin packing to improve resource utilization, reduce cloud costs, and maintain application health and performance
**Bin Packing** view provides you a clear visibility into the workloads preventing nodes from being removed from a cluster.
This view helps you evaluate resource utilization, identify idle node capacity, quickly spot node consolidation blockers, such as pods that cannot be evicted, and access detailed pod and node data for further investigation.
Bin packing view
By combining a cluster-wide view with node-level details, it helps you improve bin packing, maximize the efficiency of your cluster autoscaler (such as Karpenter or Cluster Autoscaler), and ultimately reduce Kubernetes cloud costs.
{% hint style="success" %}
Let PerfectScale remove blocked nodes for you. [Bin packing automation](https://docs.perfectscale.io/enable-automation/bin-packing-automation.md) moves the pods off underutilized nodes that your autoscaler cannot remove and hands the empty node back to the autoscaler.
{% endhint %}
## Understanding bin packing view
### Snapshot selector
Use the snapshot picker in the top-right corner to select a specific one
Snapshot selector
### Top panel summary
The **top panel** summarizes the environment, showing the number of visible nodes and pods, as well as unevictable pods. This helps you quickly identify blockers to node consolidation and scale-down.
Unevictable Pods - top panel
{% hint style="info" %}
Click **See Recommendations** in the Unevictable Pods widget to access actionable insights into why pods cannot be evicted, the associated blocked cost, and how to resolve the issue. Learn more about the recommendations [here](#unevictable-pods-recommendations).
{% endhint %}
### Instance charts
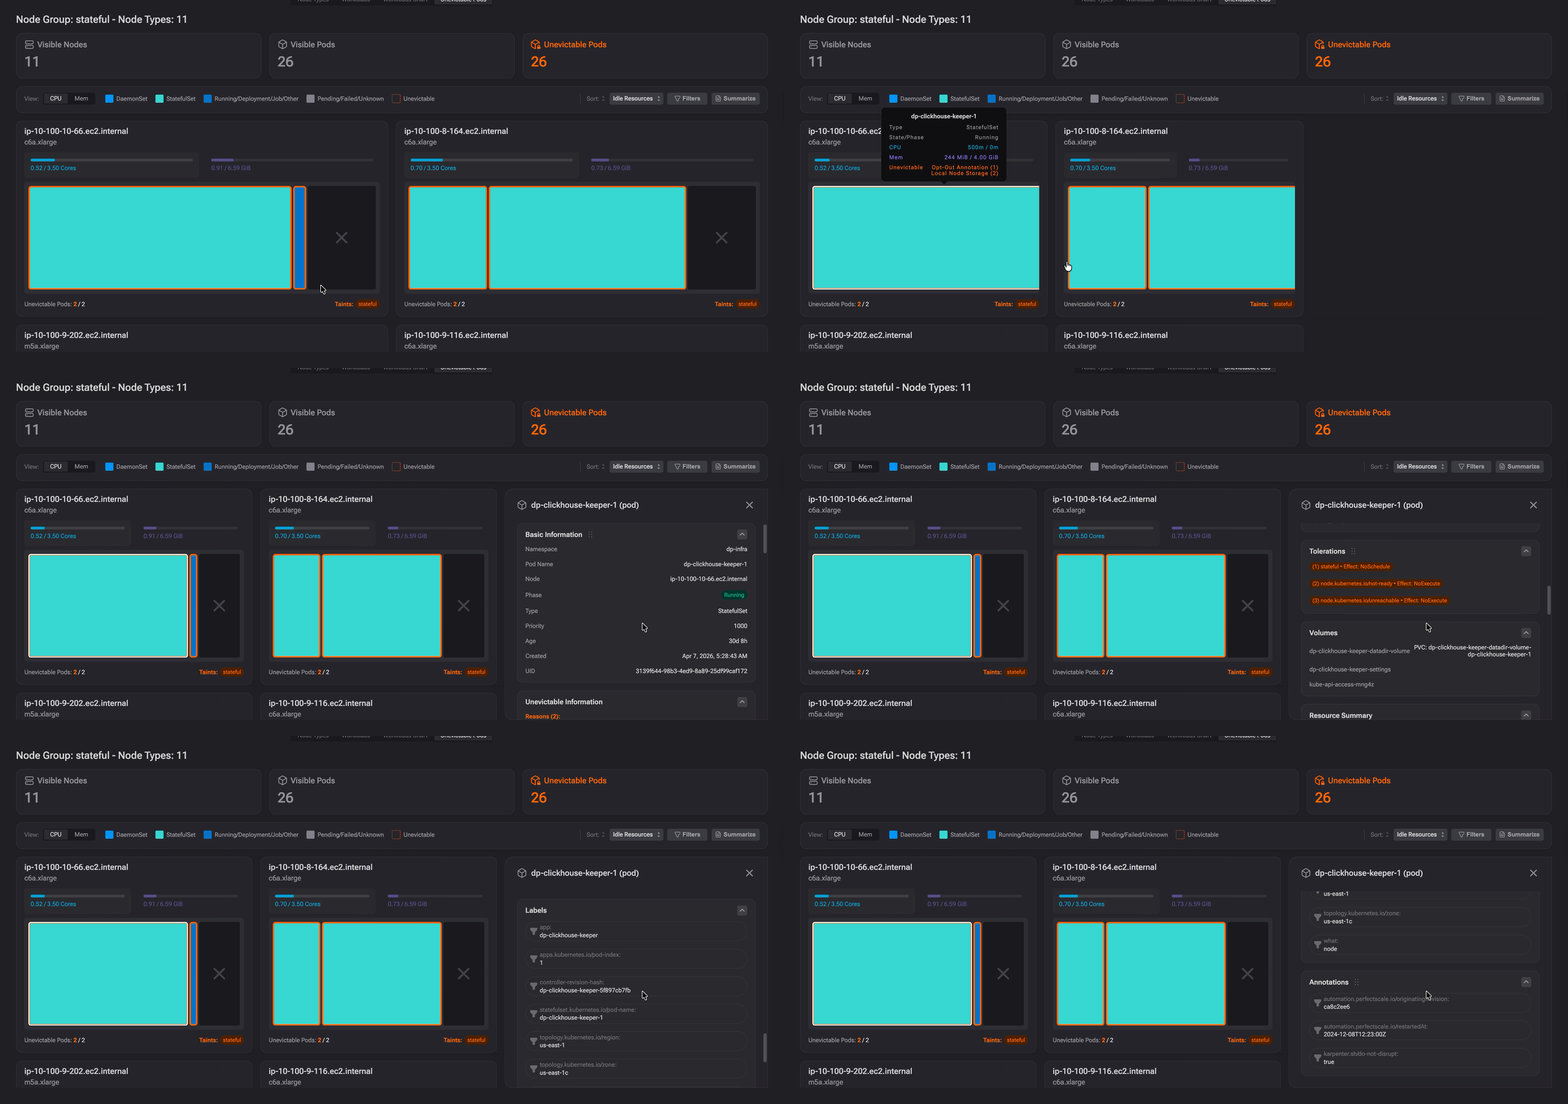
Use the **Instances charts** for deeper analysis. This view shows which pods are running on each instance, their share of resources, and whether any of them are unevictable, helping you quickly understand if pods may impact scale-down.
Instance charts
#### Customize view
Switch between memory and CPU views to evaluate resource utilization from different perspectives. Use filters to narrow down the displayed data and sorting to prioritize nodes based on relevant metrics, making it easier to identify underutilized resources and bin-packing opportunities.
Display controls
Use the **Filter** control to narrow down the view by node-level or pod-level criteria. Filters allow you to focus on specific subsets of your cluster, such as nodes with taints or pods in a particular namespace, etc.
Use the **Sort** control to reorder nodes based on different criteria, such as idle, resource utilization or unevictable pod count.
#### Node cards
Node cards
Each node is represented as a card displaying the following information:
* **Resource bars:** Horizontal bars showing requested vs. total available capacity, such as CPU, RAM, and GPU.
* **Pod treemap:** Pods inside each node are displayed as a treemap. Unevictable pods are highlighted with a orange border for quick identification.
* **Bottom labels:** Each card shows the node's taints and a count of unevictable pods.
{% hint style="info" %}
By hovering over a pod, you can see its details in the tooltip. To dive deeper and get more extensive view, click on a specific pod or node, so you can get a full details in the sidebar.
{% endhint %}
By clicking on any node or pod, you can open the sidebar detail view, which includes:
* **Item info:** name, namespace, resource requests and limits, and other key metadata.
* **Resources utilized:** a breakdown of actual resource usage (allocated vs. allocatable).
* **Conditions**: indicates if the node passed the checks, such as memory pressure, disk pressure, etc.
* **Annotations:** all Kubernetes annotations associated with the item.
* and more.
Pod details
## ⚡️ Unevictable pods recommendations
When PerfectScale detects unevictable pods, it provides precise, data-driven YAML diff recommendations that compare the current configuration with the recommended changes, helping you troubleshoot bin-packing issues and resolve them in just a few clicks.
To access Unevictable Pods recommendations, select the relevant click **See Recommendations** or the **Unevictable Pods** widget.
Unevictable pods recommendations
{% hint style="info" %}
Recommendations are automatically prioritized and ranked by cost impact, helping you focus on the highest-value optimization opportunities first and maximize savings.
{% endhint %}
Click **See Recommendation** next to a recommendation to open its details. You'll find a clear explanation of the recommended change, along with the corresponding YAML configuration that you can copy with a single click and apply directly to your manifest.
{% hint style="success" %}
To help you optimize with confidence, PerfectScale assigns a **confidence level** and **risk level** to every recommendation. These indicators help you assess the expected impact of each change, enabling safe optimization while maintaining application reliability and performance.
{% endhint %}
Some findings may be intentional and do not require any action. If that's the case, click **Mute for Workload**. PerfectScale will automatically hide the same finding for all unevictable pods in that workload, so it won't appear in future scans. You can still view muted findings in the **Muted** tab and unmute them at any time.
Mute the recommendation
{% hint style="info" %}
The **Active** and **Muted** tabs give you visibility into all findings, making it easy to see which ones still in a backlog and require attention, and which are muted.
{% endhint %}